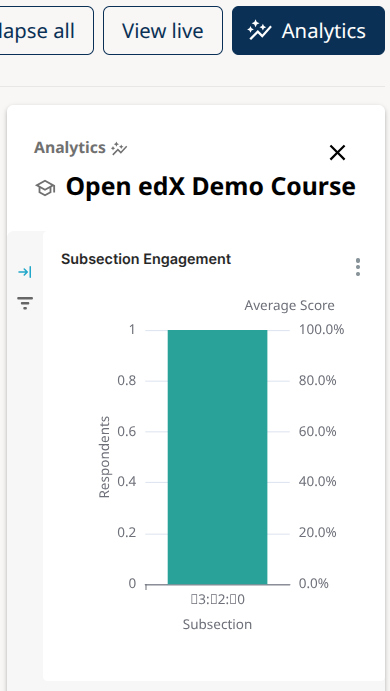
In-Context Dashboards#
In-Context Dashboards are available starting in the Teak Open edX release. They are shown in the Analytics sidebar in Studio and present metrics relevant to the content being viewed. The following dashboards are included with Aspects.
Course Dashboard#
This board contains 3 charts presenting course-level metrics, and is displayed when viewing in-context analytics for the course outline.
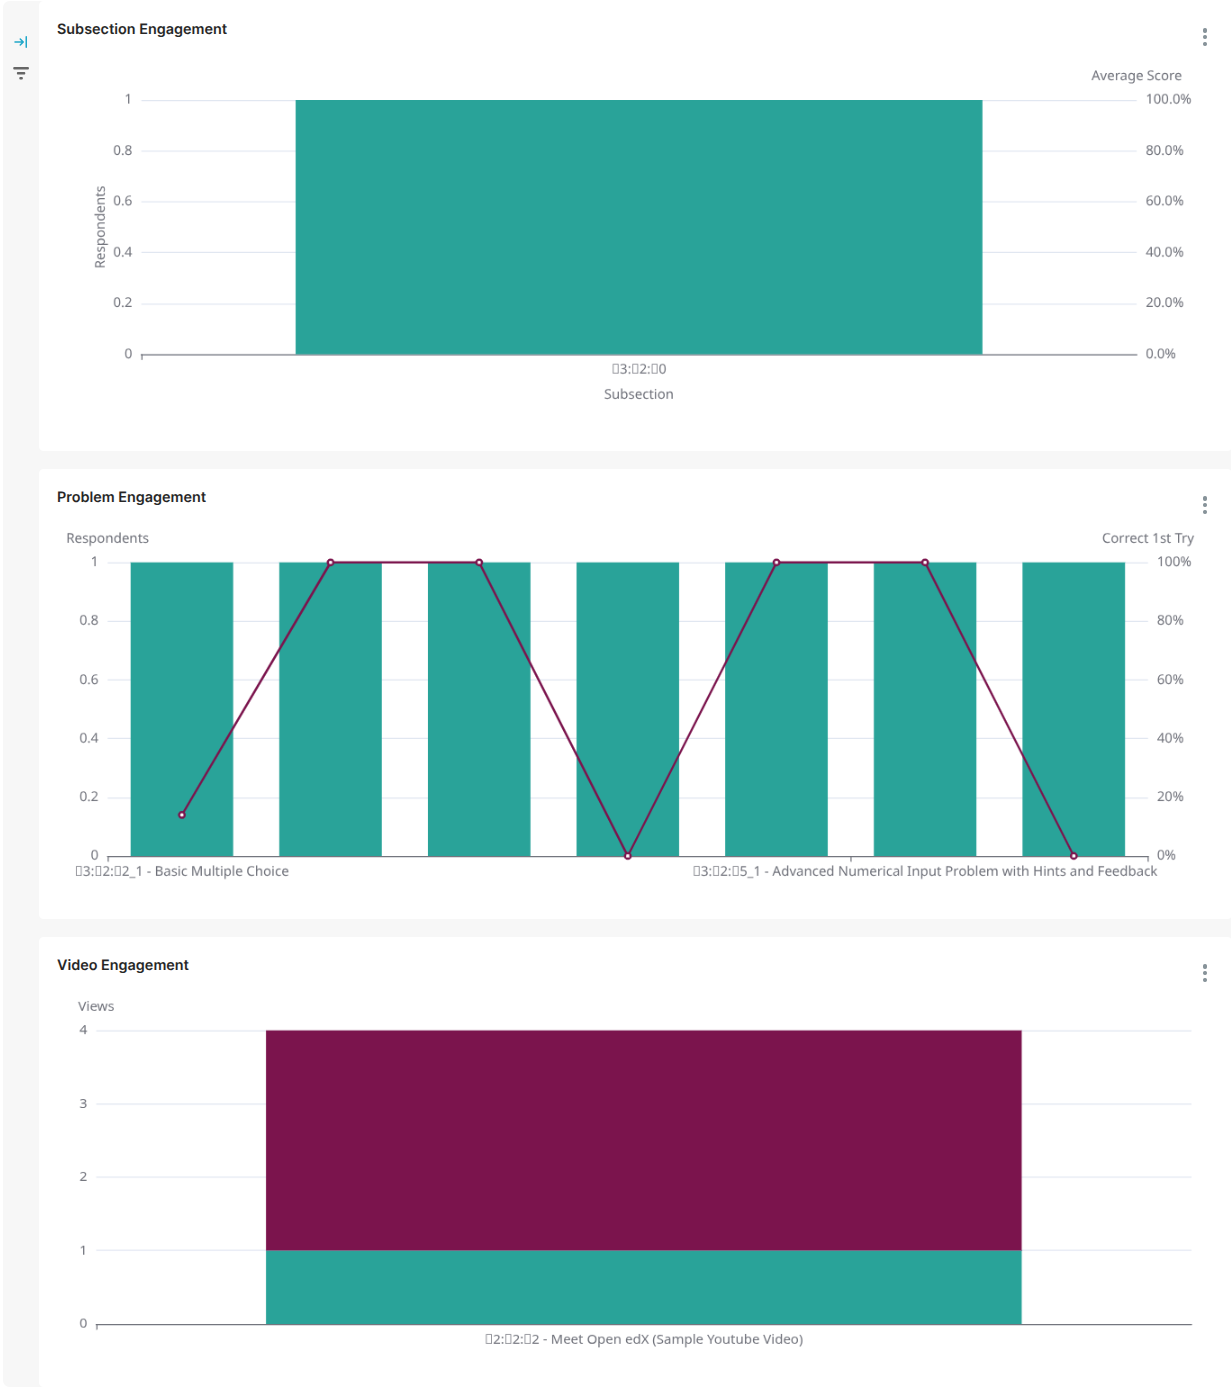
Subsection Engagement:#
The first chart shows the number of learners who attempted at least one problem in each graded subsection throughout the course and the average subsection score for those learners.
Problem Engagement:#
The second chart shows the number of learners who attempted each problem in the course and the percentage of learners who got each problem correct on their first attempt at the problem. A high percentage correct on the first attempt indicates that learners are finding the problem manageable (even easy if the percentage is very high), while a low percentage correct on the first attempt indicates that the problem may be very difficult or potentially unclear to learners.
Video Engagement:#
The third chart shows the number of unique and repeat views for each video in the course.
Graded Subsection Performance#
This board contains 2 charts presenting subsection-level metrics, and is displayed when viewing in-context analytics for a graded subsection from the course outline.
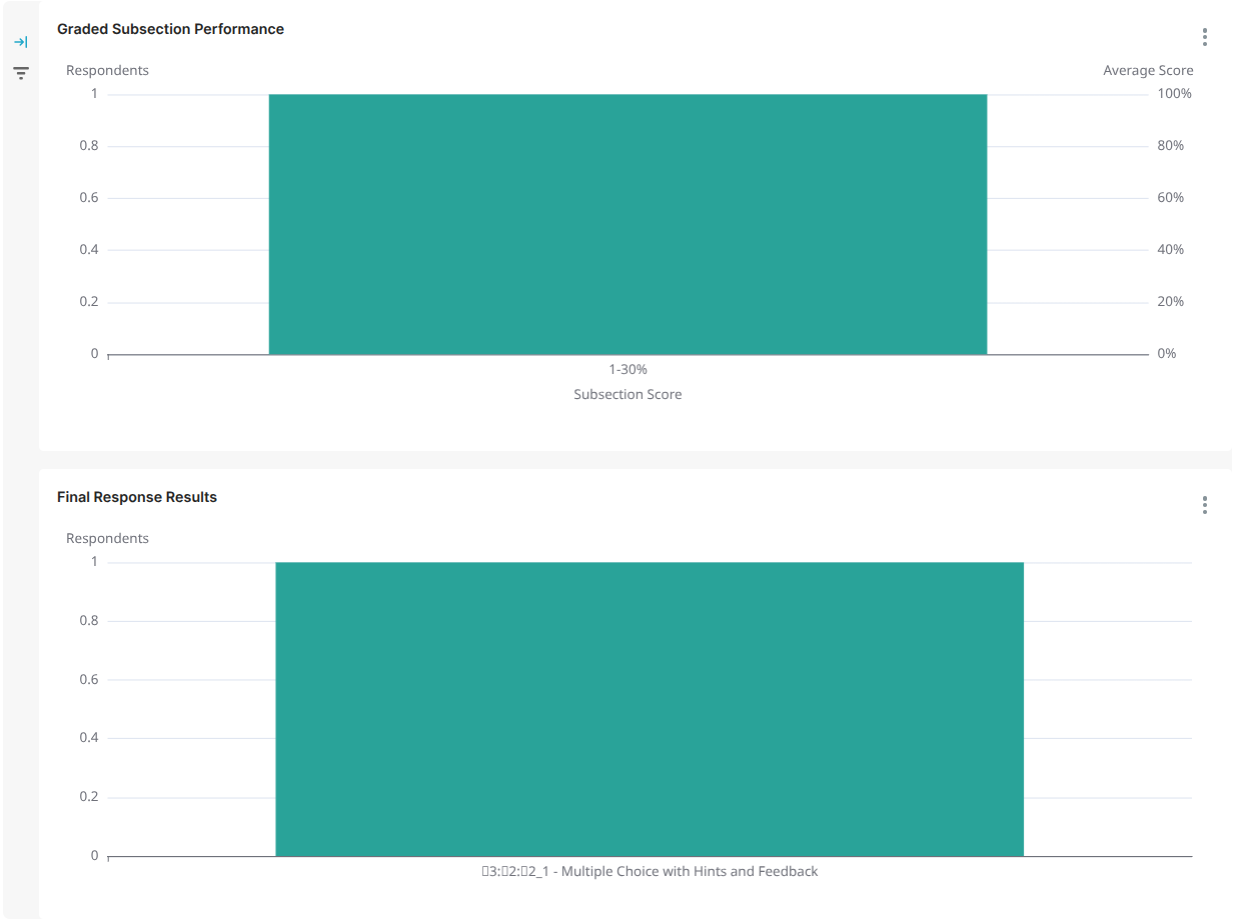
Graded Subsection Performance:#
The first chart shows the number of respondents in each score range for the graded subsection as well as the average subsection score for all learners who attempted at least one problem in the subsection.
Final Response Results:#
The second chart shows the total number of correct and incorrect responses for each problem in the subsection.
Problem#
This board contains 2 tables presenting problem-level metrics, and is displayed when viewing in-context analytics for a problem block from the course outline or from a unit page.
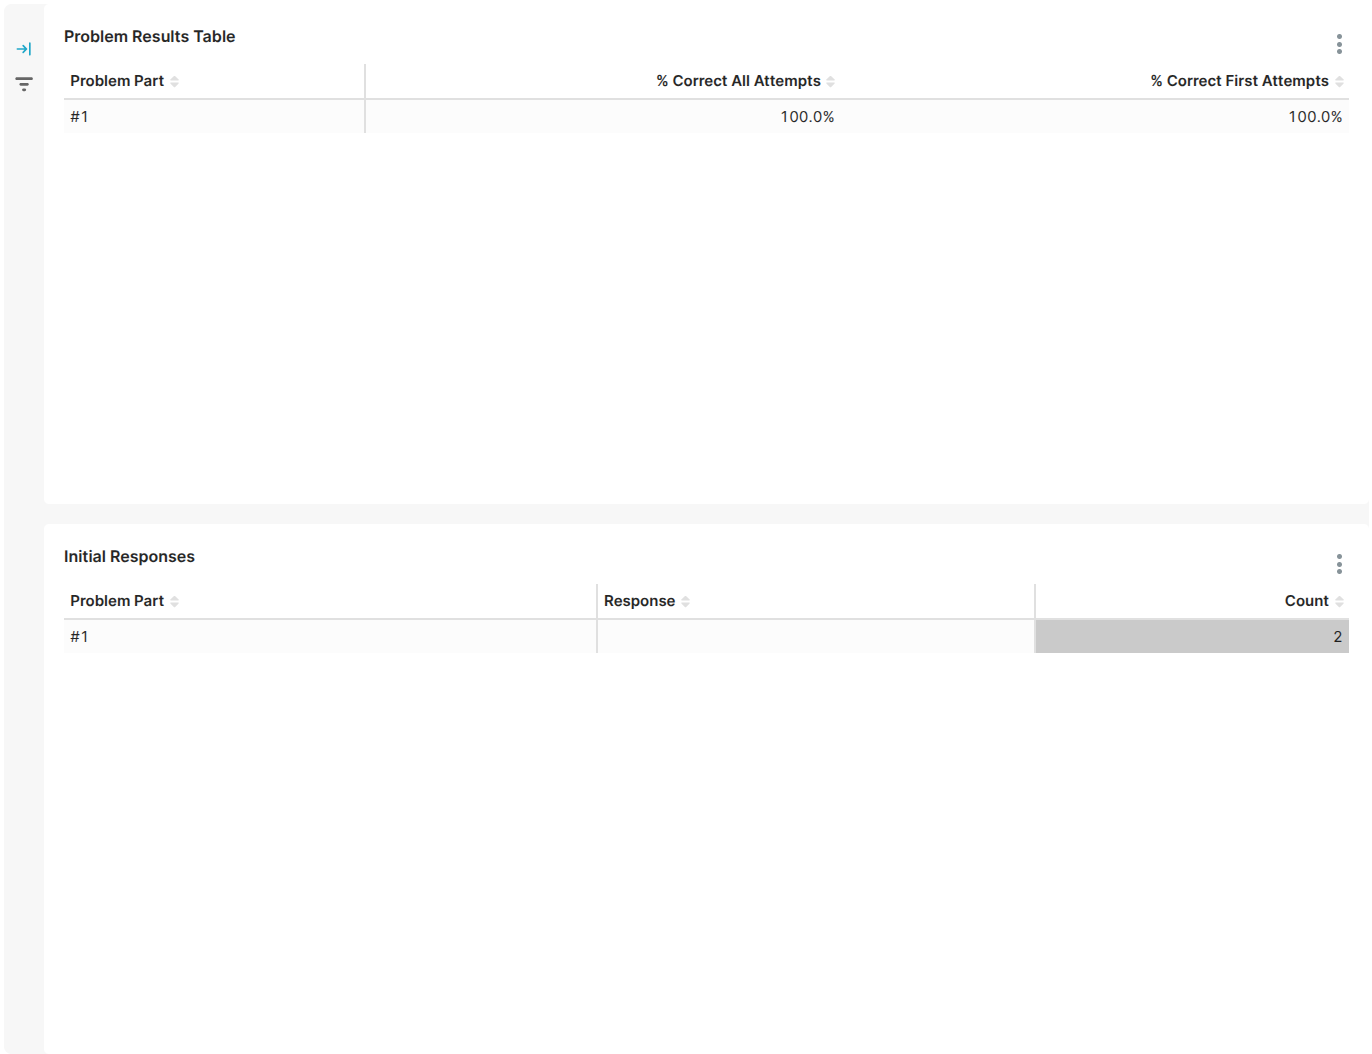
Problem Results Table:#
The first table shows the percentage of correct attempts and of correct first attempts.
Initial Responses:#
The second table shows a breakdown of how learners responded to the problem on their first attempt. The idea is to give course delivery teams a peak into learners’ thought process when they approach the problem for the first time.
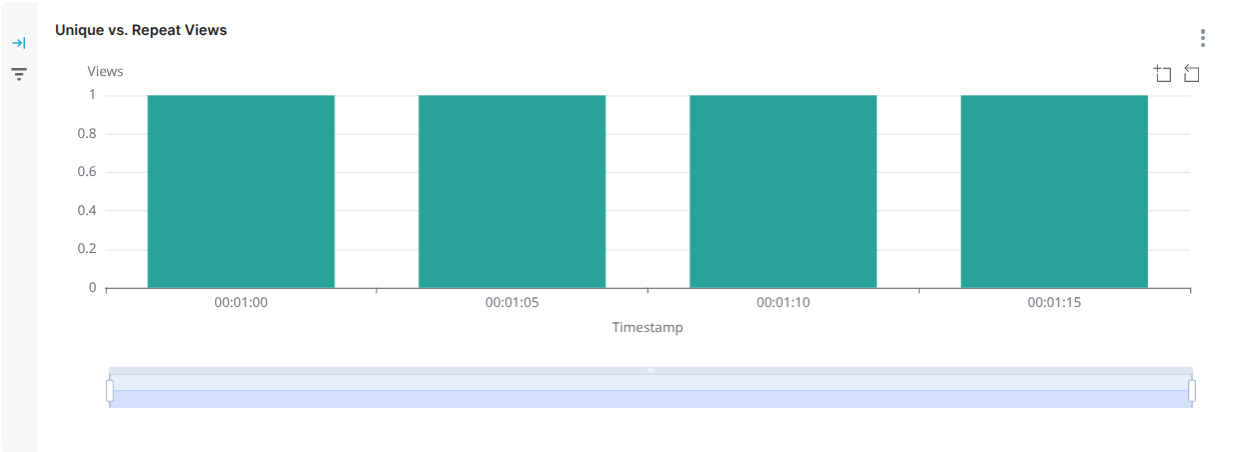
Video#
The Unique vs. Repeat Views chart shows the number of unique and repeat views for a single video in the course across the duration of the video. Timestamp ranges with a large number of repeat views should be reviewed as this might be an indicator that this particular section of video is unclear to learners.